Praxis Impact
Making a business tool make sense to academics
University staff run hands-on student projects with partner organizations. Business software didn’t fit how they work, so we researched how they do, and designed a tool around it.
My role
UX Designer
Made the concept map, interview script, flows, wireframes and usability tests. In the visual design, I made the inspiration board and some of the screens.
Teammates
Shardul & Jacob
Shardul was a fellow UX designer and made our personas. Jacob led the visual design and the style guide.
Timeline
25 weeks
A graduate capstone at the University of Maryland with a real client, from kick-off to a hi-fi prototype.
At a glance
Designed around how academics really work
The problem
It looked like a sales tool. Its users weren’t salespeople.
Experiential learning means learning by doing. Students work on real projects for real organizations, so what they learn in class finally meets the world outside it.
Behind every project sits a member of university staff. They find partners, the companies, nonprofits and city offices that give students their projects. They agree on what students will deliver, hand the project to an instructor and keep the partner happy.
On paper that’s a sales pipeline. Find a lead, close the deal, keep the customer. Plenty of business software already does that. But the people doing this job work in universities, and they don’t think like a sales team.
Our brief was to start from scratch, and make this easy and intuitive with technology.
Mapping one program
To avoid designing for one person and forgetting the rest, I mapped every person, thing and action in one program. It has three parts. Staff win a partner and agree on a scope of work, the written agreement on what students will deliver. They check it against the program’s rules. Then instructors and students carry out the project while the partner gives feedback.
- University staff
- Partners
- Students
- Instructors
That map showed one program. Our interviews soon showed that no two programs work the same way.
Research
What we heard
We worked in five-week sprints, each starting with a brief of what we’d hand the client. The first asked for a concept map, a competitive analysis and a research report.
Was this already solved?
10 products 3 compared 0 solved it
We looked closely at GradLeaders, CORE and Practera. Each did part of the job well, like flexible dashboards or clear feedback charts. None helped staff track their own process with partners from start to finish. That gap became our focus.
Four interviews, three themes
I wrote an interview script, and we talked to four university staff in very different roles. As a team, we put every finding on a sticky note and sorted the notes until themes appeared. Three held up, and each one changed what we designed.
-
Theme 1
Bring the real world into an academic setting
Staff turn what a partner wants into a project that fits their program. Every program has its own rules, so every program works differently.
There is a translating exercise in academics that is used to translate academic knowledge into business deliverables.
Demands of different academic programs are different because of what needs to be achieved.
So we designed a setup wizard, so each program maps its own process, and plain academic words instead of sales jargon.
-
Theme 2
Look after the partner from first contact onwards
Staff find partners, agree on projects, match students to them and keep the relationship going for years. They juggle many projects at once.
I have 9 projects finalized each semester. Then, I let students rank, and then decide groups.
I line up projects for each student.
So we designed one shared board that follows every project from first contact to close.
-
Theme 3
Help students and partners both win
Success isn’t a signed deal. It’s a partner who got something useful, and students who learned from doing it.
On the [partner] side, we want them to feel like they have received a deliverable that is tangible and useful.
Learning objectives are connected to student professional development.
So we designed partner pages that track satisfaction and finished projects, not deals won.
Sticky notes are from our interview notes.
Four interviews is a small sample. To check our findings held beyond the people we met, we sent a survey to staff at other universities about their process and their problems. Nobody could ask us what a question meant, so we tested the survey with peers first.
One person, many jobs
The four interviews became three personas, one for each kind of role we met. Shardul made them, shaped with the rest of the team. Put side by side, they showed something none of us had expected.
-
Supervisor Stacy
Academic supervisor, 4 years in academia
Our organization is driven by an attitude of mission, rather than money.
The hats she wears
- Administrator
- Business development
- Program manager
- Relationship manager
- Stakeholder manager
-
Bureaucrat Burton
Experiential learning coordinator, 3 years in academia
We are not at the top of mind for convincing partners to engage with our organization.
The hats he wears
- Administrator
- Business development
- Program manager
- Stakeholder manager
-
Networker Nathan
Assistant dean of alumni and corporate engagement, 7 years in academia
We want to keep track of outreach, records, host meetings, and share information about class engagements with partners.
The hats he wears
- Administrator
- Business development
- Partner engagement
- Relationship manager
- Stakeholder manager
Each of them wears four or five hats. A tool built for one job, like sales, would only ever fit one of them.
Decisions
What we decided, and why
For each persona I wrote scenarios and listed the actions each one needed. Ordered into flows, those became the structure of the whole product.
I drew every screen as a low-fidelity wireframe, then took the strongest into mid fidelity, with notes on how each part behaves. Two problems shaped the product most.
Design problem 1 · How might we
…show what matters most on a dashboard, at a glance?
Design problem 2 · How might we
…help people find a project fast, and view them their way?
List, board or grid?
Staff juggle many projects at once. One finalizes nine every semester, then matches students to them. How those projects appear decides whether staff can see what needs them today. We argued over three ways to show them.
We put it to staff in testing, and the board won. They could see where every project stood without opening any of them.
Testing
Where testing proved us wrong
We tested the mid-fidelity prototype on purpose, so people reacted to how it worked, not how it looked. Participants were university staff of different ages and experience. Each session had five tasks, like reading the dashboard or finding a project added two weeks ago.
During sessions we stuck notes on the screens wherever people hesitated. Then we laid out every session task by task, with a colour for each kind of note.
- Red, a problem
- Green, it worked
- Yellow, what people said or did
- Blue, an idea
Three things we got wrong
What we saw
People stumbled on the product’s terms, and one fixed process didn’t match how their own program worked.
What we changed
A short setup wizard. New users map their own partner process step by step, so the tool follows their process from day one.
What we saw
The word “opportunity” felt vague for a partner who hadn’t signed up yet. People suggested “leads” or “prospects”.
What we changed
Plainer stage names. The first stage of every project became Prospect.
What we saw
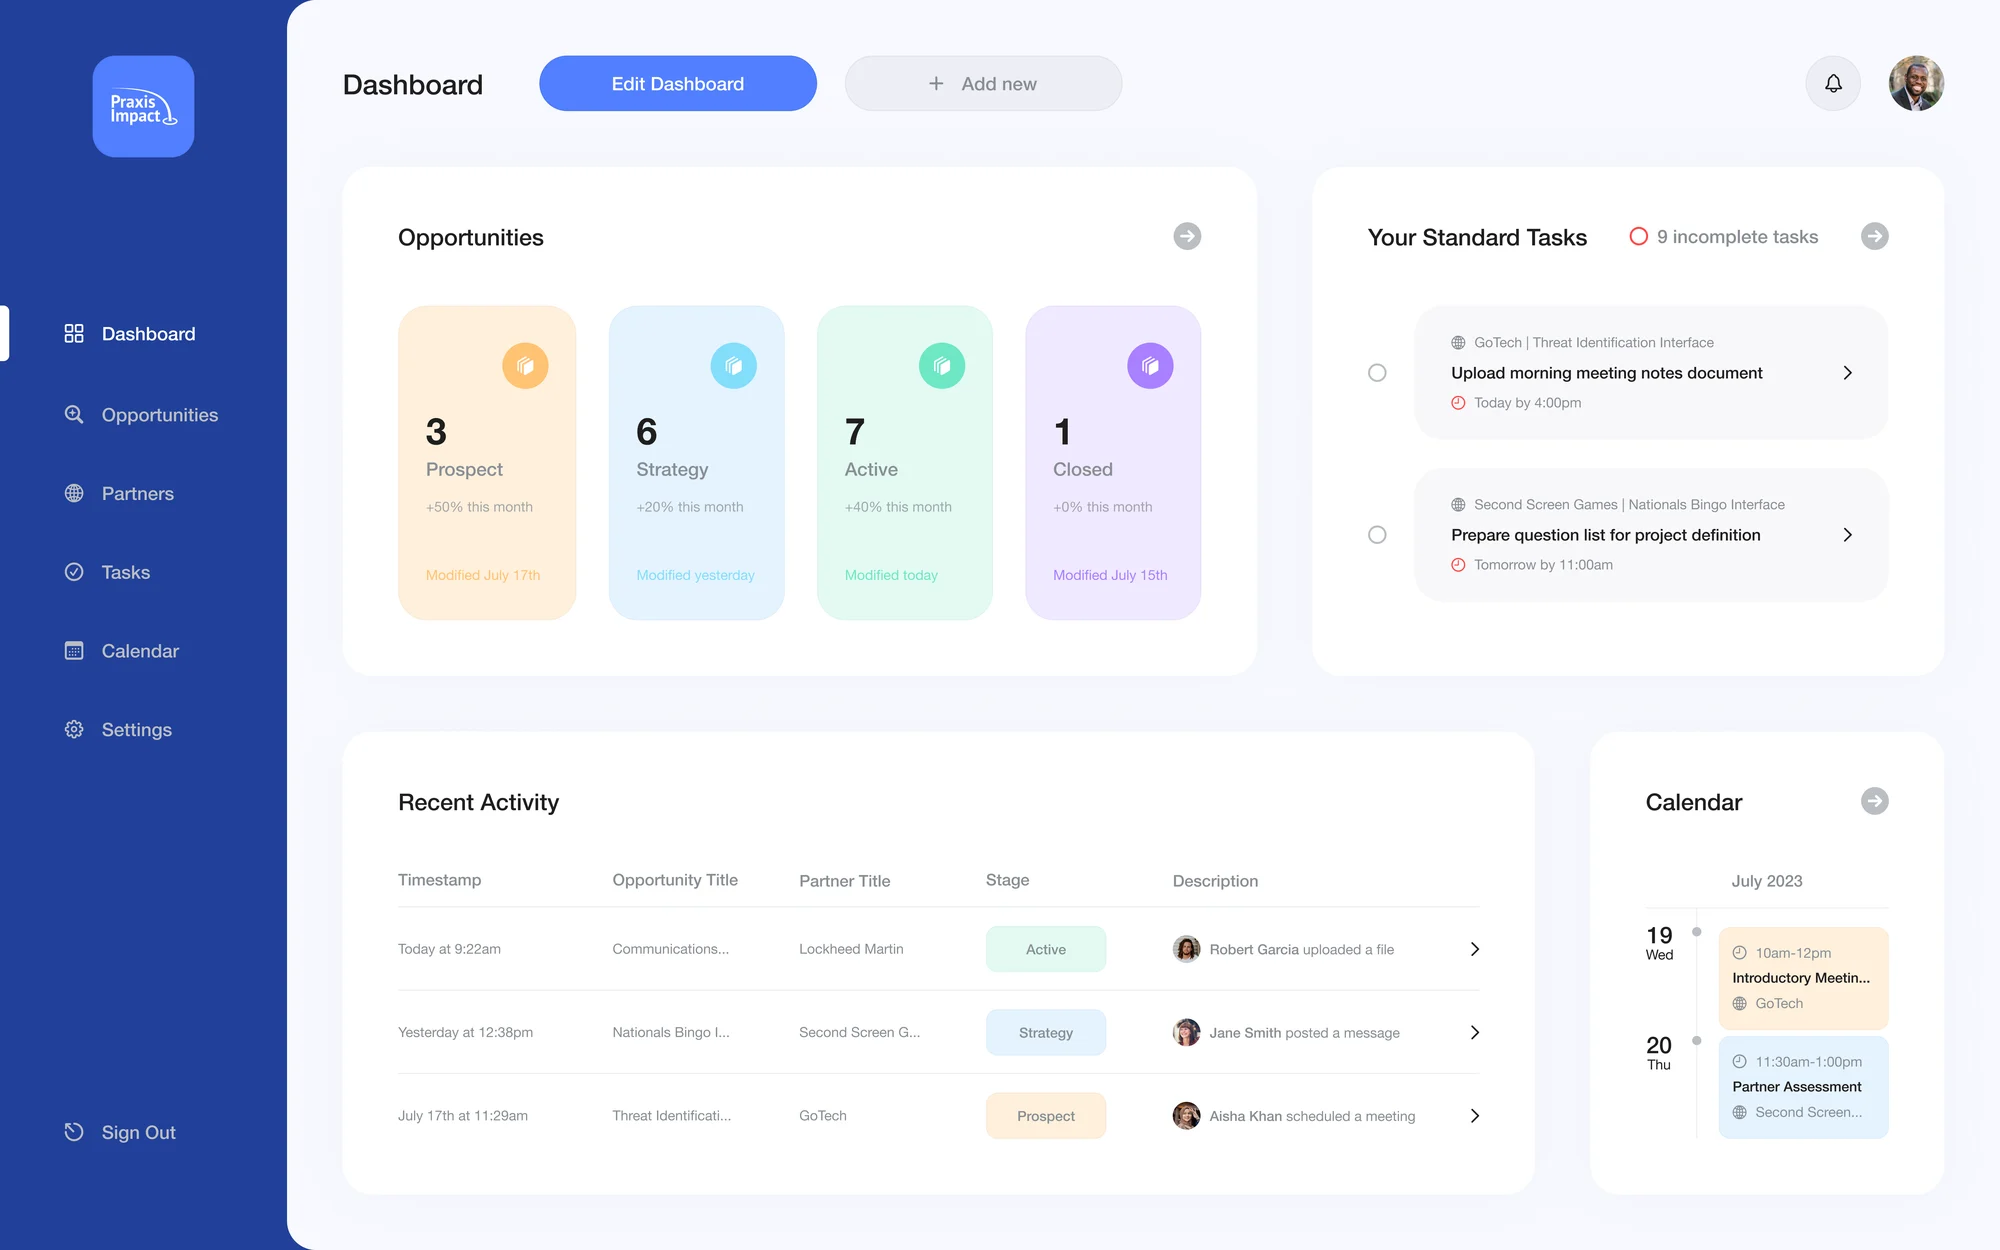
Tasks on the dashboard looked clickable but didn’t say what clicking would do. One person clicked a task expecting to create a to-do.
In the final design
Every action has its own control. A checkbox to finish a task, an arrow to open it, and a separate button to create one.
Testing backed up the research
Not every note was about the screens. Some told us again what the interviews had, in different words.
At one university, five colleges each keep their own partner list. Nobody knows which college is contacting whom.
Success means internships completed and students who finished, not how many partners were contacted.
One person didn’t know what “SOW” meant. Their program calls it a Memorandum of Understanding.
They’d tried sharing Google spreadsheets, but the sheets just sat there.
Paraphrased from our test notes.
We then ran a second round of tests in the hi-fi prototype, with tasks like signing up through the wizard and moving a new partner through the stages.
Final designs
Giving it a look and feel
With every screen working, we turned to the visual design. Jacob led it and made the style guide. I made the inspiration board and designed some of the screens. The hi-fi design keeps everything we’d settled in research and testing.
Outcome
From a blank page to a tested design
In 25 weeks we went from a one-line brief to a hi-fi prototype, tested twice with the people who’d use it, with research behind every decision. We presented the final designs to our client, who approved them.
- 4interviews with university staff
- 3personas from what we heard
- 10products reviewed
- 2rounds of usability tests
What I delivered
- A concept map of everyone involved, kept up to date as we learned
- An interview script, and the findings behind our personas
- Scenarios and flows that became the product’s structure
- Low- and mid-fidelity wireframes with interaction notes
- Test plans and clickable prototypes for both rounds of testing
- The inspiration board and some of the hi-fi screens
What I learned
This capstone taught me what it’s like to design for a live project with real impact on people.
We hit setbacks and owned our failures together. Along the way we built the habits to coordinate, communicate and deliver something we’re proud of.